With the latest update to the Diversio Platform, when you open your Dashboard, you’ll now see a new and improved look at your DEI insights.
Analysis Re-designed
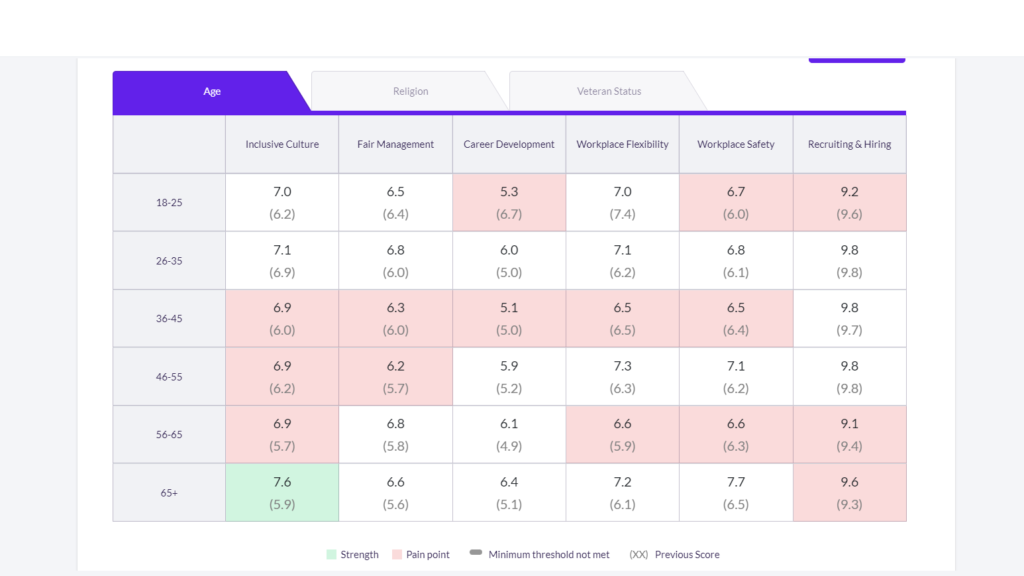
The release of the latest update also continues to improve the Inclusion Analysis you know and love. Giving you a Heat Map view of your highest and lowest performing groups, departments, locations, and more
Customize
The new release enables custom demographics to be tracked using the same Heat Map format you love and allows you to add bespoke questions on your survey template, showing you results directly in the dashboard. This means you can now add in custom questions like, “Did you find value in our recent allyship training?” and even add your current engagement survey directly into the Diversio Dashboard to track results over time.
You can also segment how your score is benchmarked. In the new design, you can see:
- An Overall Inclusion Score™ is inclusive of all internal demographic & metric scores
- An Industry Inclusion Score™ measures your DEI performance against the scores of other organizations in your industry
- A Dominant Group Score measures the experience of your organization’s Dominant Group against the remaining demographics
- A Minority Group Score measures the experience of your organization’s Minority Group against the remaining demographics
- Department Scores measure the experience and performance of each department separately
- Tenure-level Scores separate the measurements of each managerial level
- Location (Regional) Scores measure DEI performance in different regions.
 Insight-based Solutions
Powered by the Inclusion Score™, the Dashboard now provides you with insights to signal areas that need the most attention. You can stay accountable by creating goals unique to your company’s needs and as a result, receive curated program recommendations to intervene and improve your Score(s) over time.
Goals
Once you select an insight, you’re able to customize the goal. You can decide the increase in the KPI, which KPI you want to focus on, which group, and the timeframe in which you want to accomplish the goal.
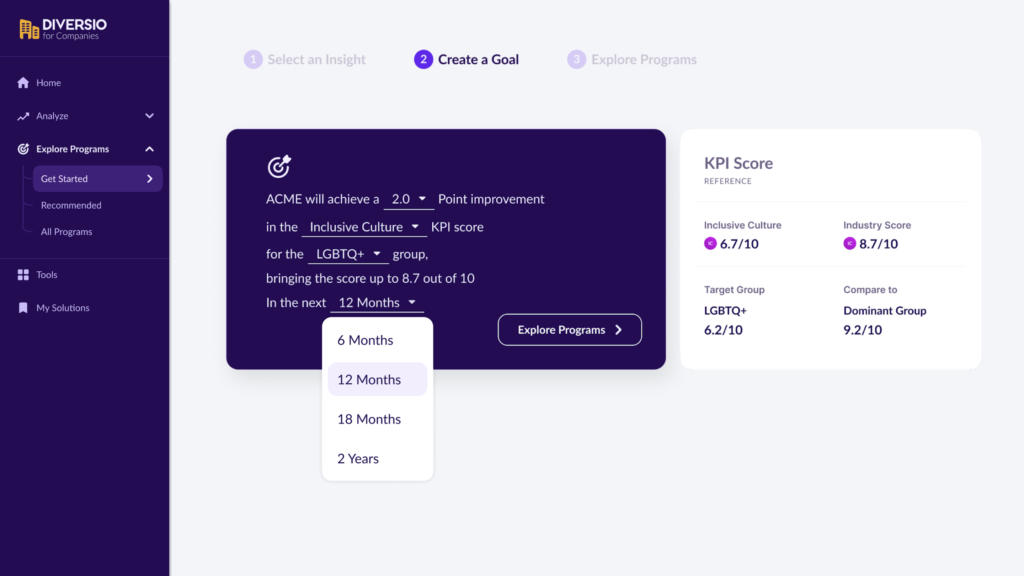 Looking to measure a different KPI? Now, you can create a custom goal that’s not based on a specific insight generated by the Dashboard and track your progress over time.
Programs
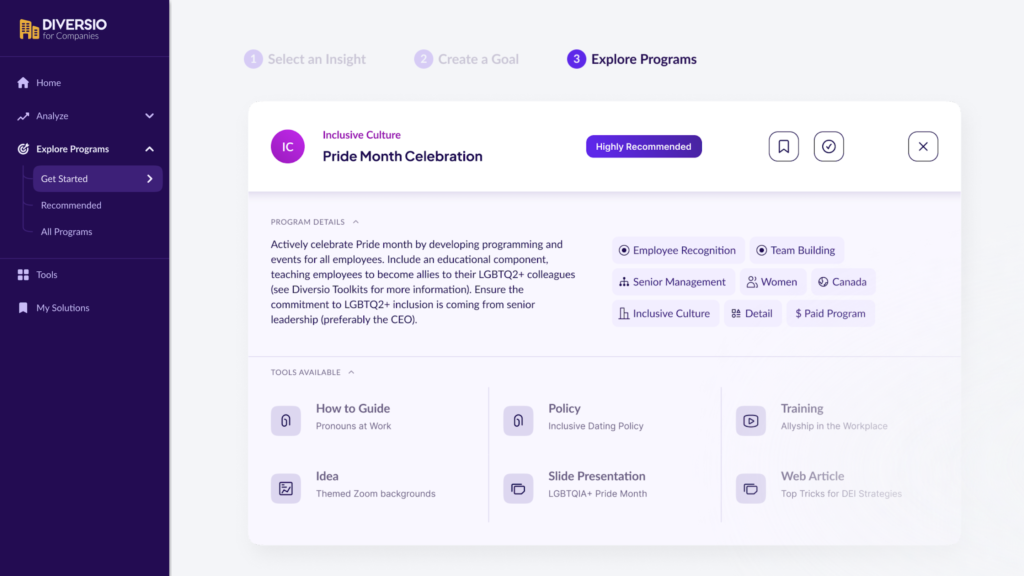
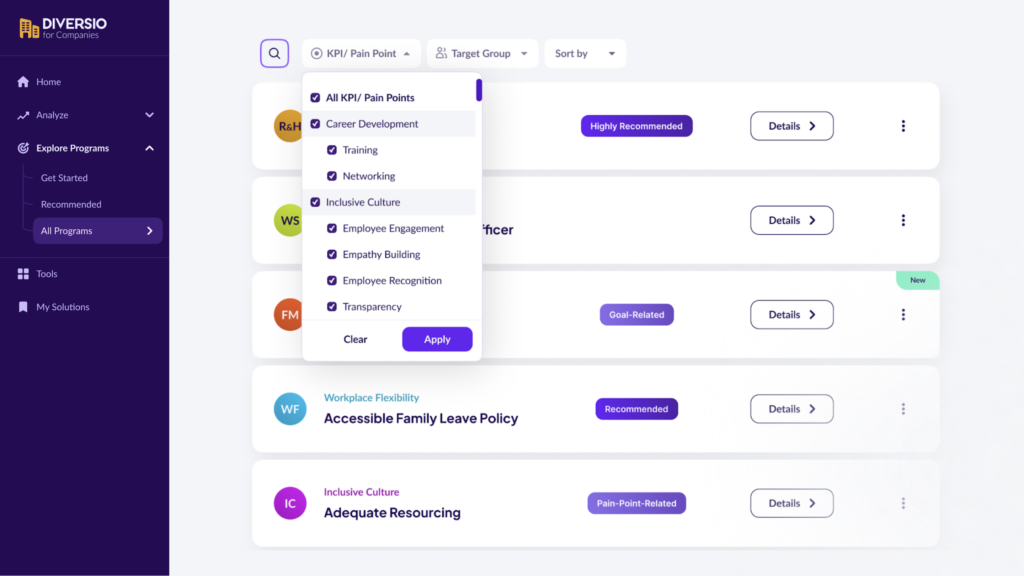
With the new Programs & Tools tab, Programs are curated based on your insights, your pain points, KPI goals, and the target groups most impacted.
If a program we suggested doesn’t resonate with you, you can explore all the programs we offer and develop a custom program with the guidance of our team of DEI experts. It’s easy to find what you need; the Program Library is categorized by the KPIs they address, can be keyword searched, and may be filtered by target group or KPI.
The Programs provided within your Dashboard are high level and focus on specific areas where tools can be implemented to increase an Inclusion Score™. For example, a program called “Inclusive Promotions” would provide tools to help you develop a more holistic inclusive promotion program at your company.
Tools
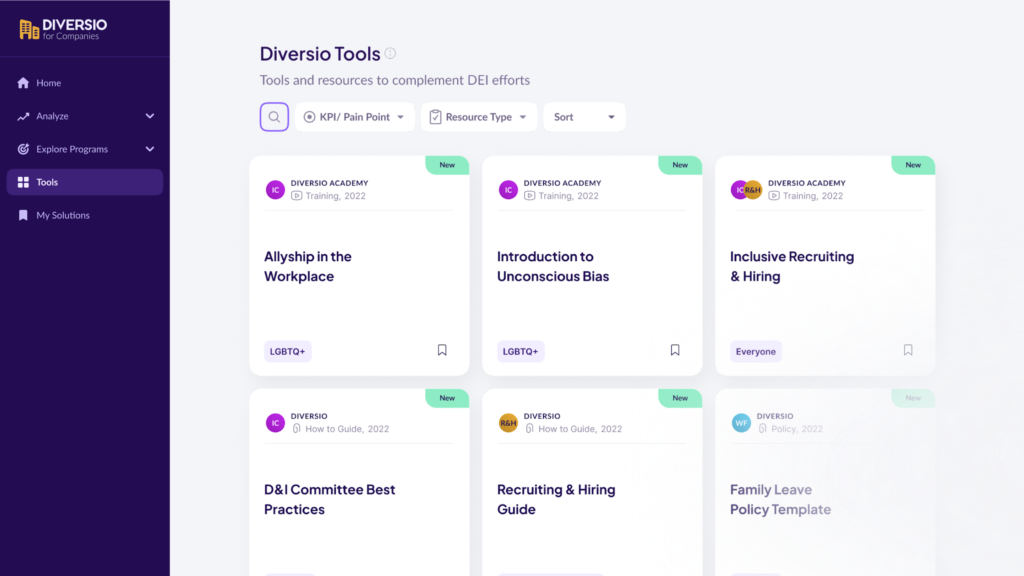
Diversio Tools lets you browse for specific resources even if you don’t implement a program. Some of the most popular Tools within Programs can also be found in the Tools Library; these resources are components of our programs that can be accessed individually. The Tools Library includes a variety of resource formats including training videos, how-to guides, policy templates, toolkits, and more.
My Solutions
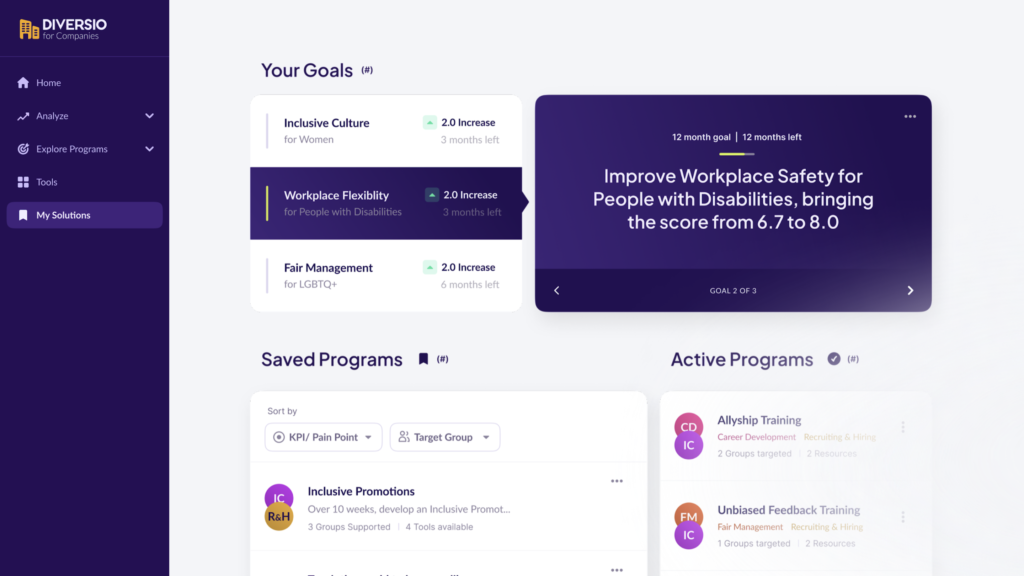
Any Program or Tool you come across can be saved and will be stored in the My Solutions tab for you to refer to later. This hub for your goals, your active programs, and also those you saved but haven’t committed to yet, will become the central place for you to track your goals and stay accountable. With every survey cycle, you will see your efforts impacting your Inclusion Score™ towards your set goal(s).
Looking for More Information?
Want to learn more about the latest update? Schedule a demo with one of our DEI experts to see how Diversio can accelerate your DEI initiatives.
